Back to SentiCharts


Next update in
00
:
00
:
00
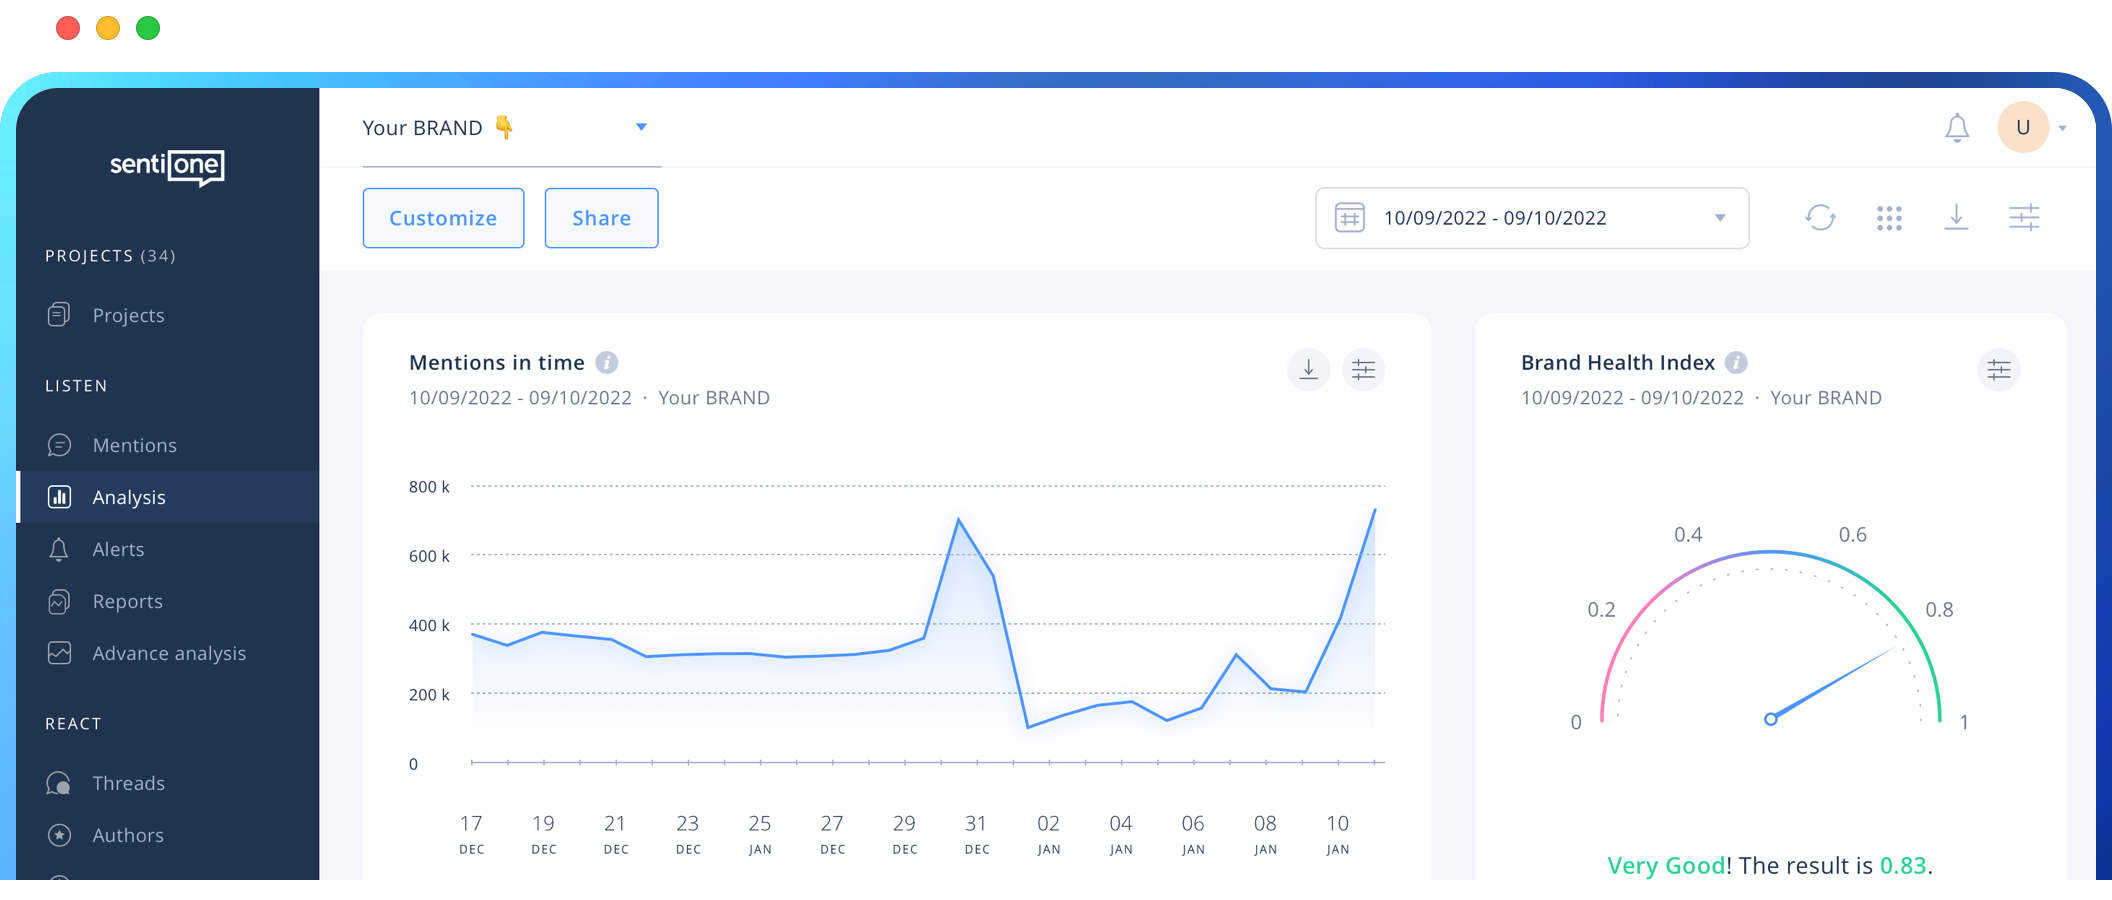
Dyson
Household electronics
#5
Social index
328
Mentions
982
BHI
0.55
This is a simplified view of SentiOne charts and graphs.
Would you like to see a more interactive version?
This is a simplified view of SentiOne charts and graphs.
Thanks for getting in touch!
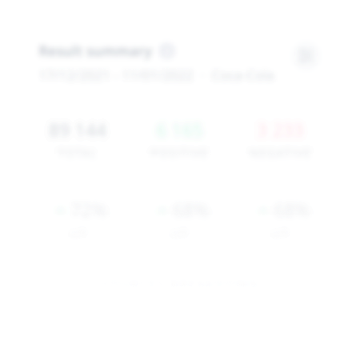
Displays the reach of all results found within a given project, divided by sentiment and sources.
| Sentiment | Reach |
|---|---|
| Positive | 160985 |
| Negative | 303930 |
| Total | 15962849 |
| Source | Reach |
|---|---|
| Webpages | 9276371 |
| Social Media | 6183140 |
| Total | 15962849 |
| Source | Reach |
|---|---|
| Blogs | 41349 |
| Forums | 5777 |
| Websites | 9127149 |
| 4408462 | |
| 11464 | |
| Video | – |
| Reviews | 102096 |
| 1763214 | |
| TikTok | 503338 |
Unlock more graphs, charts and insights!
Book a free demo to see all possibilities of online monitoring. Let’s analyse your brand, competition or any social trend!
Book a demoThis is a simplified view of SentiOne charts and graphs.
Would you like to see a more interactive version?
This is a simplified view of SentiOne charts and graphs.
Thanks for getting in touch!